Do gamma walls help predict price? We tested a year of data.
Published September 7, 2026. US stocks and ETFs, January to December 2025.
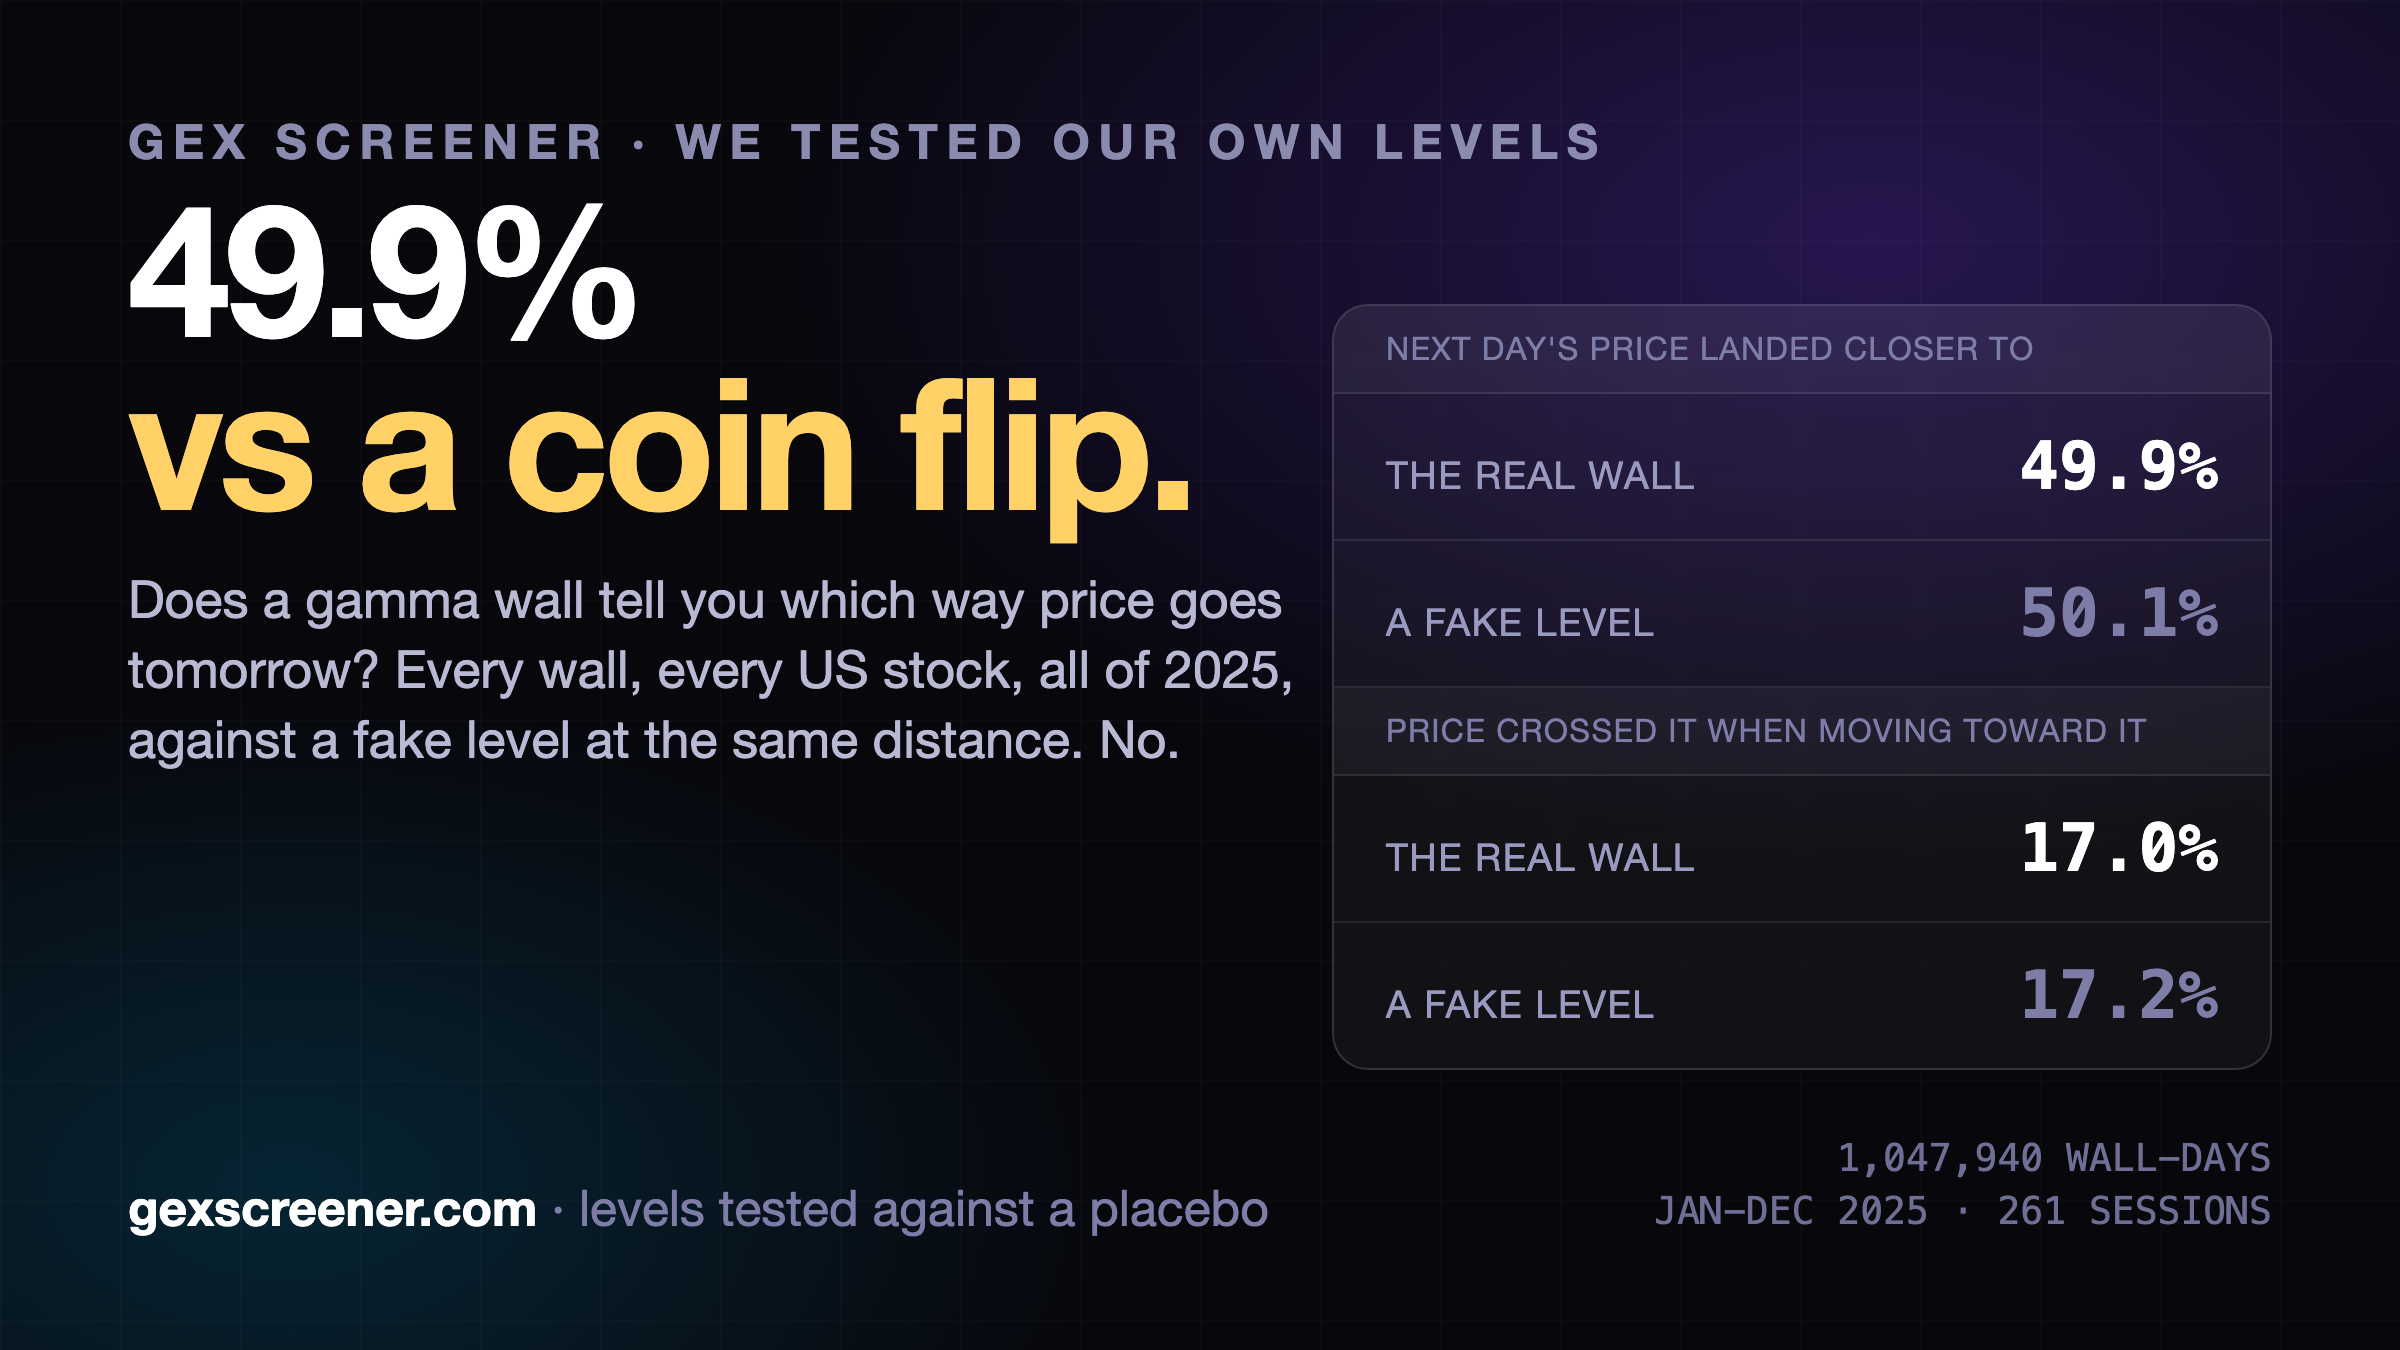
1,047,940 wall-days, January to December 2025, 261 trading sessions.
We built GEX Screener to help people read options positioning. We also wanted to know how much they could rely on the gamma walls we display.
GEX tools often describe these levels as support, resistance, or prices where a stock might stall. The explanation usually comes back to options positioning and how dealers hedge. We wanted to test whether the levels actually helped predict what happened to price.
We bought a full year of end-of-day options chain data for US stocks and ETFs. For each wall, we recorded a comparison level and checked the next day's result.
How we tested the walls
A stock closing near a gamma wall can look convincing on a chart. With so many option strikes around the current price, though, some near misses are inevitable. We needed a way to tell whether the gamma wall added anything.
We gave each wall a fake level at the same distance on the other side of the stock price. If a stock traded at $100 and its wall was at $105, the comparison level was $95. We then checked which level price finished closer to, how often price crossed each one, and how often it closed nearby.
The comparison level came from that distance alone. We fixed the design before reading the outcomes and used 50.0% as the reference point for the closer-to-level test.
We compared 1,047,940 stock and ETF wall-days with matched fake levels across 2025.
Price finished closer to the wall 49.9% of the time
| Slice | Events | Closer to wall |
|---|---|---|
| All | 1,047,940 | 49.9% |
| Call walls (above spot) | 509,454 | 50.8% |
| Put walls (below spot) | 538,486 | 49.0% |
In the stock and ETF sample, price finished closer to the wall 49.9% of the time. Call walls came in at 50.8% and put walls at 49.0%, a split consistent with the market's mild upward drift in 2025.
We checked whether the result depended on liquidity, how clearly one wall stood out, or its distance from price. We also compared round $5 strikes with other strikes and positive-gamma days with negative-gamma days.
None of those breakdowns showed a consistent advantage for the wall.
Price crossed both levels at similar rates
We also counted crossings on days when price moved toward each level.
| Level | Moved toward | Crossed | Rate |
|---|---|---|---|
| Real gamma wall | 523,006 | 88,912 | 17.0% |
| Mirrored fake level | 524,934 | 90,479 | 17.2% |
The crossing rates were almost identical, at 17.0% for gamma walls and 17.2% for the comparison levels. In this stock and ETF sample, the walls offered little evidence of a next-day barrier effect.
A small difference on expiration day
Pinning could be easier to detect on expiration day. To check, we selected the biggest-gamma strike for the nearest expiration using the previous day's data, then measured the expiration-day outcome. This gave us 45,130 events in the stock and ETF sample.
| Measure | Expiring wall | Fake level |
|---|---|---|
| Next day closed closer to it | 50.7% | 49.3% |
| Crossed when moving toward it | 37.5% | 38.2% |
| Closed within 0.5% of it on expiration day | 10.9% | 10.2% |
45,130 events.
The expiring wall did slightly better on all three measures. It was the only test where the wall beat its comparison level on every measure. Price closed within 0.5% of the wall in 10.9% of events, compared with 10.2% for the fake level. That amounts to about one additional close nearby per hundred events.
Gamma and the size of the next move
We next looked at how much price moved. The usual gamma explanation predicts smaller moves when net gamma is positive and larger moves when it is negative.
For this test, we used 885,882 symbol-days in the stock and ETF sample. We ranked each symbol's moves against its own moves during the year so that differences between quiet and volatile stocks would not drive the result.
At first, the pattern looked clear. More-negative-gamma days were followed by larger moves. Gamma also changes alongside implied volatility, or IV, during market stress. We checked whether the pattern remained after accounting for both IV and the previous week's price direction.
| IV level | Prior week | Most negative vs. most positive gamma |
|---|---|---|
| Low | Fell | +0.008 |
| Low | Rose | +0.000 |
| Mid | Fell | +0.016 |
| Mid | Rose | -0.004 |
| High | Fell (stressed) | +0.083 |
| High | Rose | -0.009 |
The clearest difference appeared in stocks that had fallen over the prior week and had high IV. In that group, next-day moves ranked six to ten percentile points higher after the most-negative-gamma days. The other five groups were close to zero.
An earlier draft reported a small effect of about two rank points after accounting for IV. Breaking the sample down by the prior week's direction changed our interpretation. The average combined a larger effect in falling stocks with high IV and little effect in the other five groups.
How much does gamma weighting add?
We repeated the comparison for falling stocks with high IV, using the put/call open interest ratio in place of gamma-weighted exposure.
| Signal | Effect in the stressed cell |
|---|---|
| Gamma-weighted net exposure | +0.083 |
| Plain put/call OI ratio | +0.066 |
The plain put/call ratio reproduced about 80% of the gamma result. Among stocks that had already fallen and had high IV, heavier put positioning was associated with a larger move the next day. Gamma weighting added a smaller amount to that relationship.
That makes the open interest itself worth examining when reading the screener.
Results for SPX, SPXW, SPY and QQQ
We ran a separate move-size analysis for index products, keeping the results for each instrument separate. We accounted for VIX and at-the-money implied volatility together, following the design of the published multi-year study used for comparison.
| Control applied | SPX | SPXW | SPY | QQQ | Zero band |
|---|---|---|---|---|---|
| Raw correlation | -0.386 | -0.397 | -0.389 | -0.354 | |
| VIX + ATM IV removed | -0.219 | -0.208 | -0.208 | -0.214 | ±0.13 |
| + Scheduled events excluded | -0.206 | -0.166 | -0.197 | -0.186 | ±0.14 |
The published eight-year SPY study found approximately zero after the same controls. We have not resolved that disagreement. Excluding April 2025, the month of the tariff shock, slightly increased the relationship in our sample.
For SPY, after accounting for at-the-money IV, negative-gamma days were followed by about 0.2 to 0.5 percentage points more daily range than positive-gamma days.
Results for IWM, DIA, RUT and NDX stayed inside their noise bands. The single-stock result was about one eighth as large as the index result. In this year's data, the relationship stood out for SPX, SPXW, SPY and QQQ.
We need a second year of data before using this index finding in the product or its marketing. The current result covers one year and one market regime, and we have not established what causes it.
How we use these results
These results shape how we describe GEX Screener. It shows how options positioning is distributed across strikes and how much open interest sits in puts and calls.
The next-day tests in our stock and ETF sample gave us little reason to treat the displayed walls as price targets. We did find a relationship between put-heavy positioning and larger moves in stocks that were already falling with high IV. That is a narrower use for the data, and one we can explain with the results above.
We will keep testing these relationships as we add more data.
Methodology
- We used end-of-day options chains for US stocks and ETFs in 2025, covering approximately 4,900 symbols over the year.
- We calculated gamma exposure as Black-Scholes gamma times open interest times spot price squared, with calls positive and puts negative. These are the same walls the screener displays. The calculation does not identify dealers' positions.
- Each comparison level sits the same distance from spot as its wall, on the opposite side. We fixed the design before reading the outcomes.
- Each day's sample includes the symbols with listed options on that date, including names later delisted. Of those symbols, 1,169 disappear from the data before year end.
- We excluded 0DTE contracts. Same-day-expiring contracts have zero gamma in the end-of-day data we used. Testing their effect requires intraday snapshots.
- The headline 49.9% gives every wall-day equal weight. We also calculated the share for each trading day, then averaged those daily shares. Giving each of the 258 days equal weight produced 49.2%, with a standard error of 0.40 percentage points and an approximate 95% interval of 48.4% to 50.0%. That interval applies to the daily average. Days with more qualifying walls have more weight in the headline result.